Ore Factory Squad Statistics: Where Did the Money Go?
Read Income and Expense categories, separate loans from sales, and choose the next employee, upgrade, mining or delivery check.
On this page
Sales, contracts & costs
Compare income with expenses; follow the largest relevant category to its physical task before buying another upgrade.
- Bring / prerequisite
- Your company’s current cash movements
- Check this UI first
- Computer to Statistics: Income Breakdown and Expense Breakdown
- Move on when
- A specific spending or delivery check; Loans stay separate from product sales.
The v1.1.2 screen is not a profit calculator; Items Produced minus Items Delivered is not verified inventory.
Find the expense before buying more
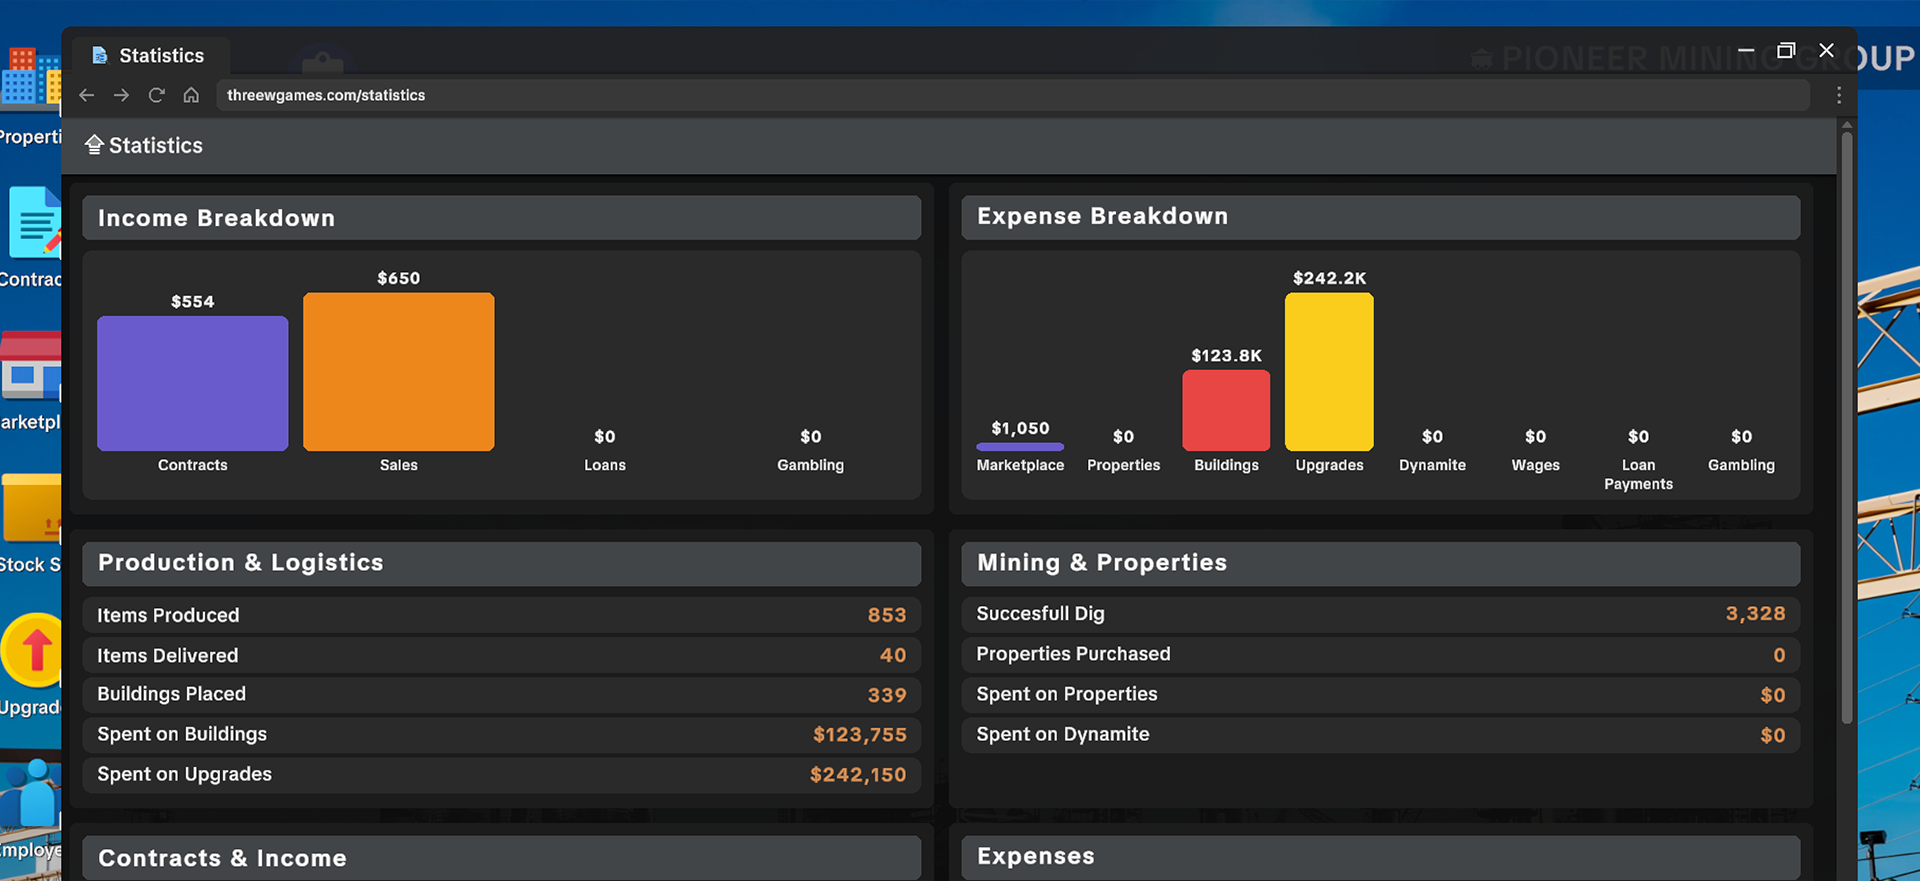
Open Statistics on the in-game computer. Compare Income Breakdown with Expense Breakdown, then follow the largest spending category to the relevant factory task. Loans are cash coming in, not product sales, so a growing Income chart alone does not prove your factory is profitable.
Read cash movement, then choose a check
Income shows Contracts, Sales, Loans and Gambling. Expenses show Marketplace, Properties, Buildings, Upgrades, Dynamite, Wages, Loan Payments and Gambling. Separate borrowing and one-off purchases from the repeat task you are trying to improve.
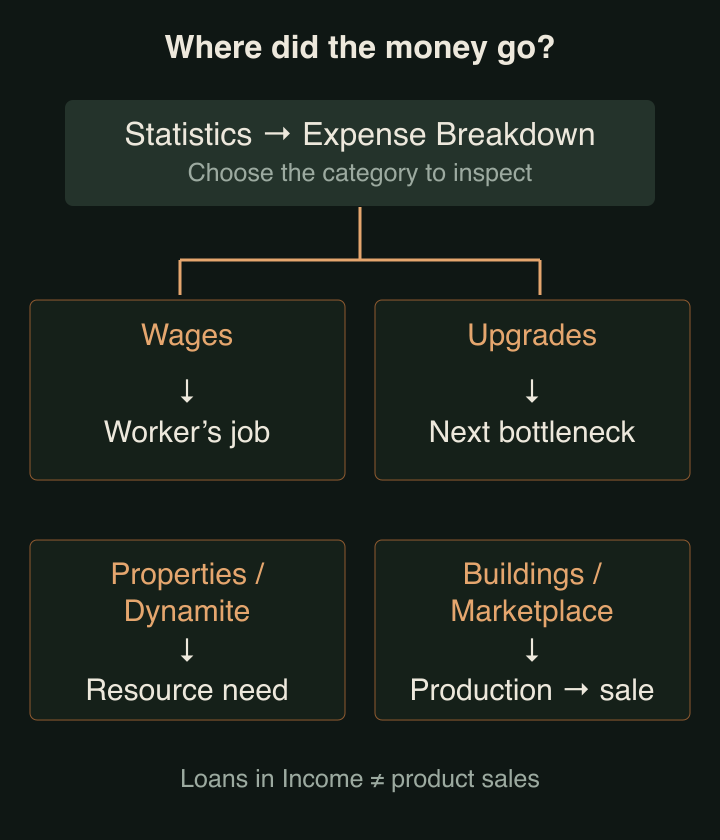
- Wages stand out: check the employee’s actual job and whether that role is helping the blocked step. A wage total by itself does not identify an idle worker.
- Upgrades stand out: compare the next upgrade with your bottleneck before buying another. The most expensive category is a reason to inspect spending, not proof the purchase was wrong.
- Properties or Dynamite stand out: compare remaining resources and property needs. Check the resource you need for the next sale or contract before expanding mining expenditure.
- Buildings or Marketplace stand out: trace material movement and production, then the contract and selling workflow. An expanded factory still needs a working path to delivery.
- Loan Payments or Gambling stand out: keep those cash movements separate from judging the sales output of a machine. This screen does not supply a loan strategy or a guaranteed way to earn money by gambling.
Cross-check production and delivery
Production & Logistics shows Items Produced, Items Delivered, Buildings Placed, Spent on Buildings and Spent on Upgrades. Use these alongside the charts to decide whether your next inspection belongs on production, logistics or capital spending.
If production is happening while your delivery task remains unfinished, inspect the physical route and the accepted order. Start with the conveyor bottleneck checklist for stopped goods, or the Pallet Packer workflow for an active contract. Do not calculate inventory as Items Produced minus Items Delivered: the announcement does not define those counters well enough to make that a stock formula.
Mining & Properties shows Successful Dig, Properties Purchased, Spent on Properties and Spent on Dynamite. If those costs dominate, check mining access and remaining resources before treating the factory machines as the cause.
Make one useful next move
- Read the largest relevant expense in your own save.
- Open its matching task guide above and inspect that part of the factory.
- Resolve the physical blocker or decide whether the next purchase is necessary.
- Return to Statistics as a summary, while checking the actual sale, delivery or resource result in the game.
The screenshot is a single company’s example. It does not establish a normal cost ratio, target income, counter reset or refresh period. The visible lower headings do not establish extra menus or filters.
Source and version
Official After Hours v1.1.2 announcement, October 1, 2026 introduces the Statistics app and shows the named categories. Read October 17, 2026. This guide explains those fields; it is not a profit calculator or a claim of current-client testing.